
Our cloud-connected vehicle insights provide unmatched visibility across transport projects, new capabilities for building use cases, and improved outcomes for stakeholders.
%20(5)%20(1).gif)

Understand where friction loss happens and how this impacts surrounding roads.
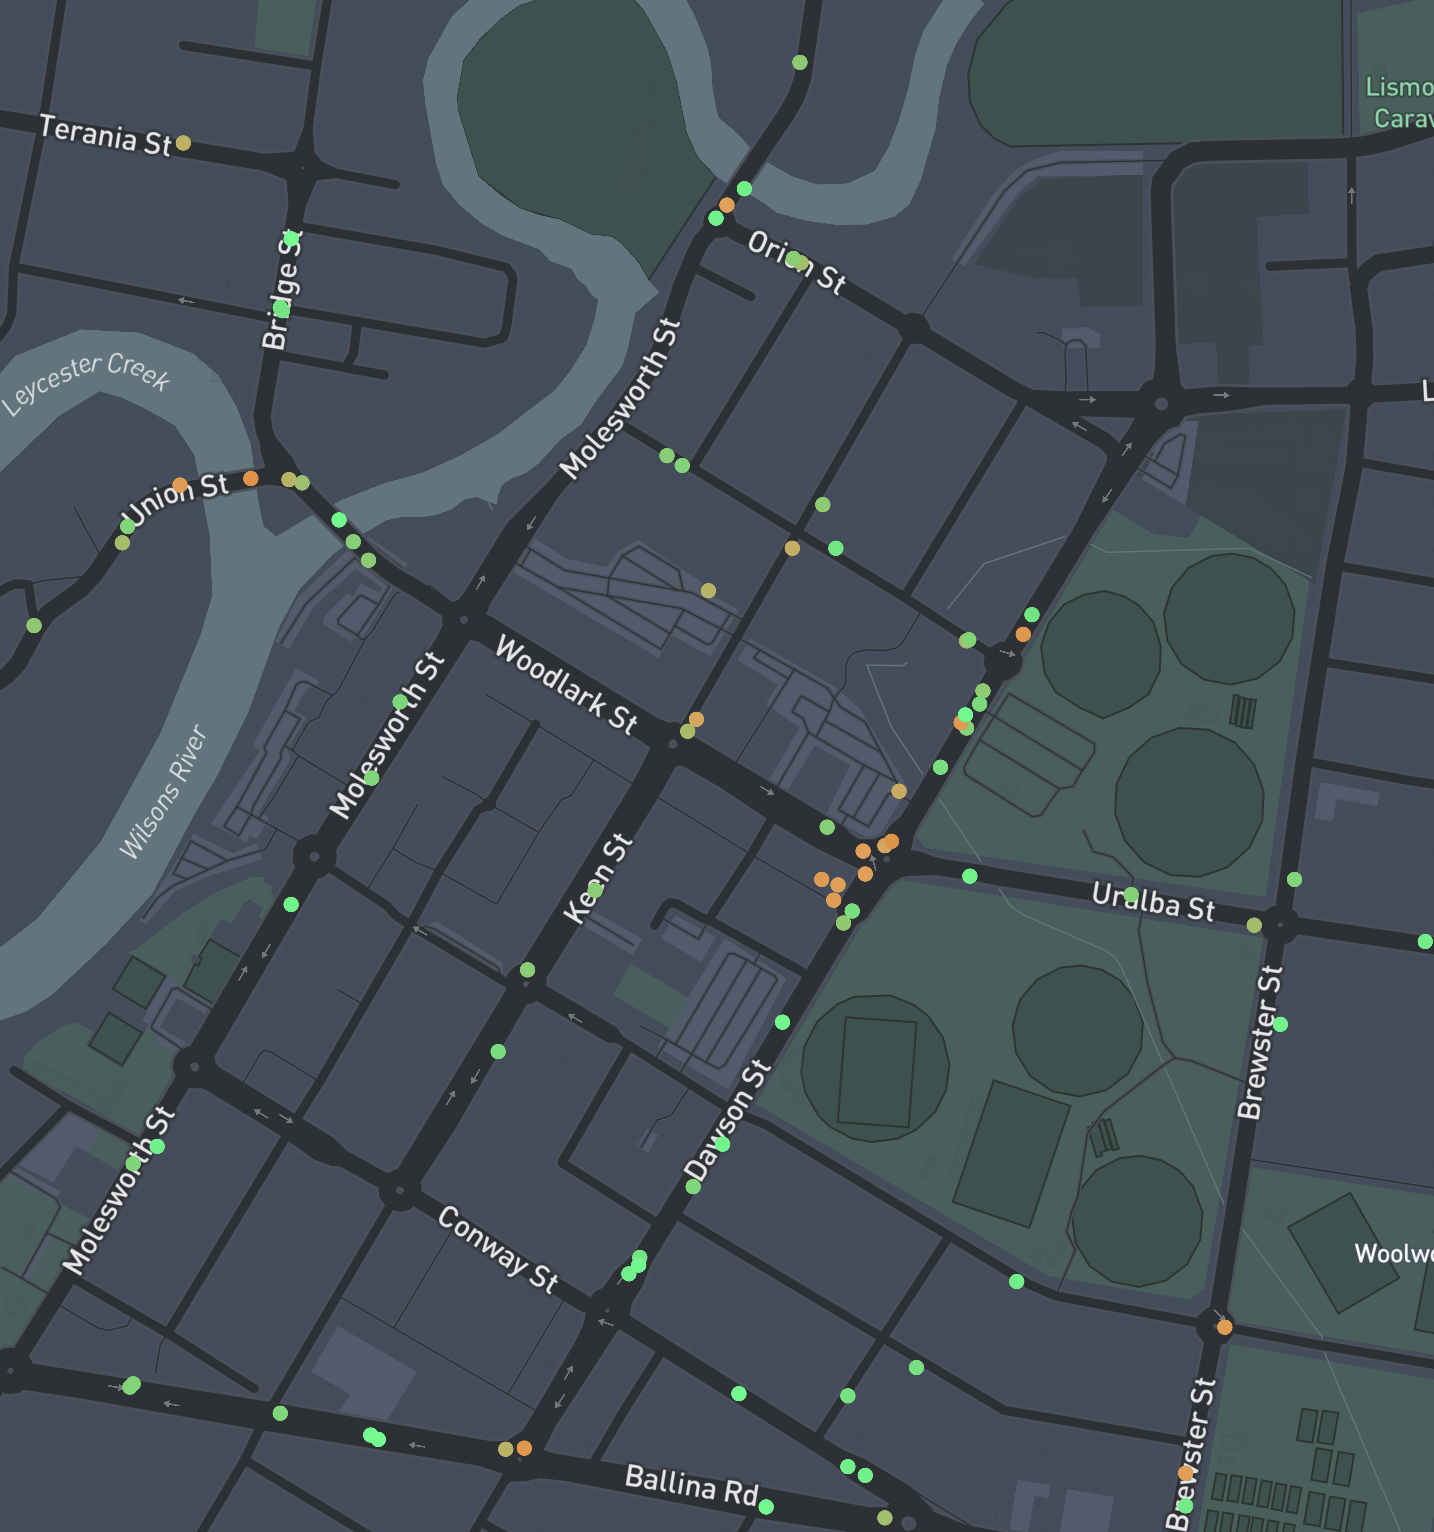
Understand where drivers are hard braking or swerving, and profile risk.

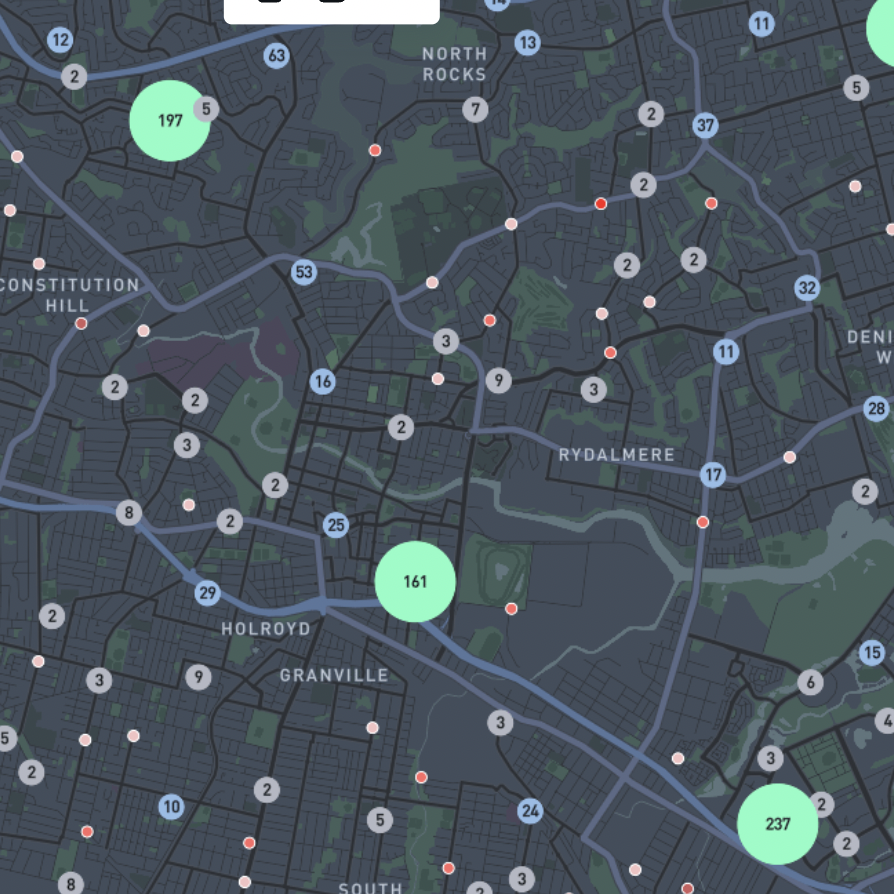
Understand travel times, trip distribution, travel routes, speed, and hourly volumes.
Understand asset maintenance and changes to road surface deterioration.
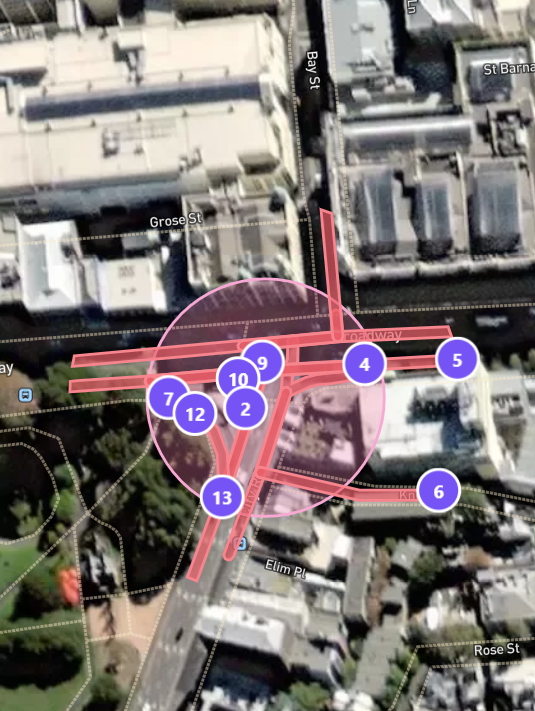
View the level of service and queue lengths in the new intersection analysis tool.

Get better visibility over projects and access datasets that enable you to solve unique problems that traditional hardware-reliant methods can't, including freight, road safety, and asset maintenance use cases, at scale.
Our passive vehicle-generated insights enable you to make decisions that are backed by data. Access billions of data points, for every road, instantly and share them with other Compass users.
G-force
Braking and Steering
Accelerating
Origin-Destination
Roll, pitch, yaw
Location and Travel Time
Volume
Freight
Make and model
More to come

A council used origin-destination data to understand rat-running in residential areas, and what percentage of drivers were bypassing arterial roads.
.png)
Compass IOT was asked to select vehicle makes/models that were either prime movers or goods and services to understand freight movements.

By Using Compass, a university analysed driver behaviour entering or near the crossings by looking at g-forces, braking, accelerating, and swerving behaviour