
Sunshine Coast Council retrofitted speed cushions at a pedestrian crossing to reduce vehicle speeds near a school zone.
Book a DemoSunshine Coast Council wanted to measure the impact of retrofitting speed cushions at a pedestrian crossing on driver behaviour. Specifically, they wanted to measure changes in vehicle speeds before and after the installation to create a safe route to school. Sidelines Traffic conducted the speed analysis on behalf of the council.
The crossing is located on Kalana Rd in Warana, in a 60km/h zone, en route to a local primary school. The cushions were retrofitted in January 2024.

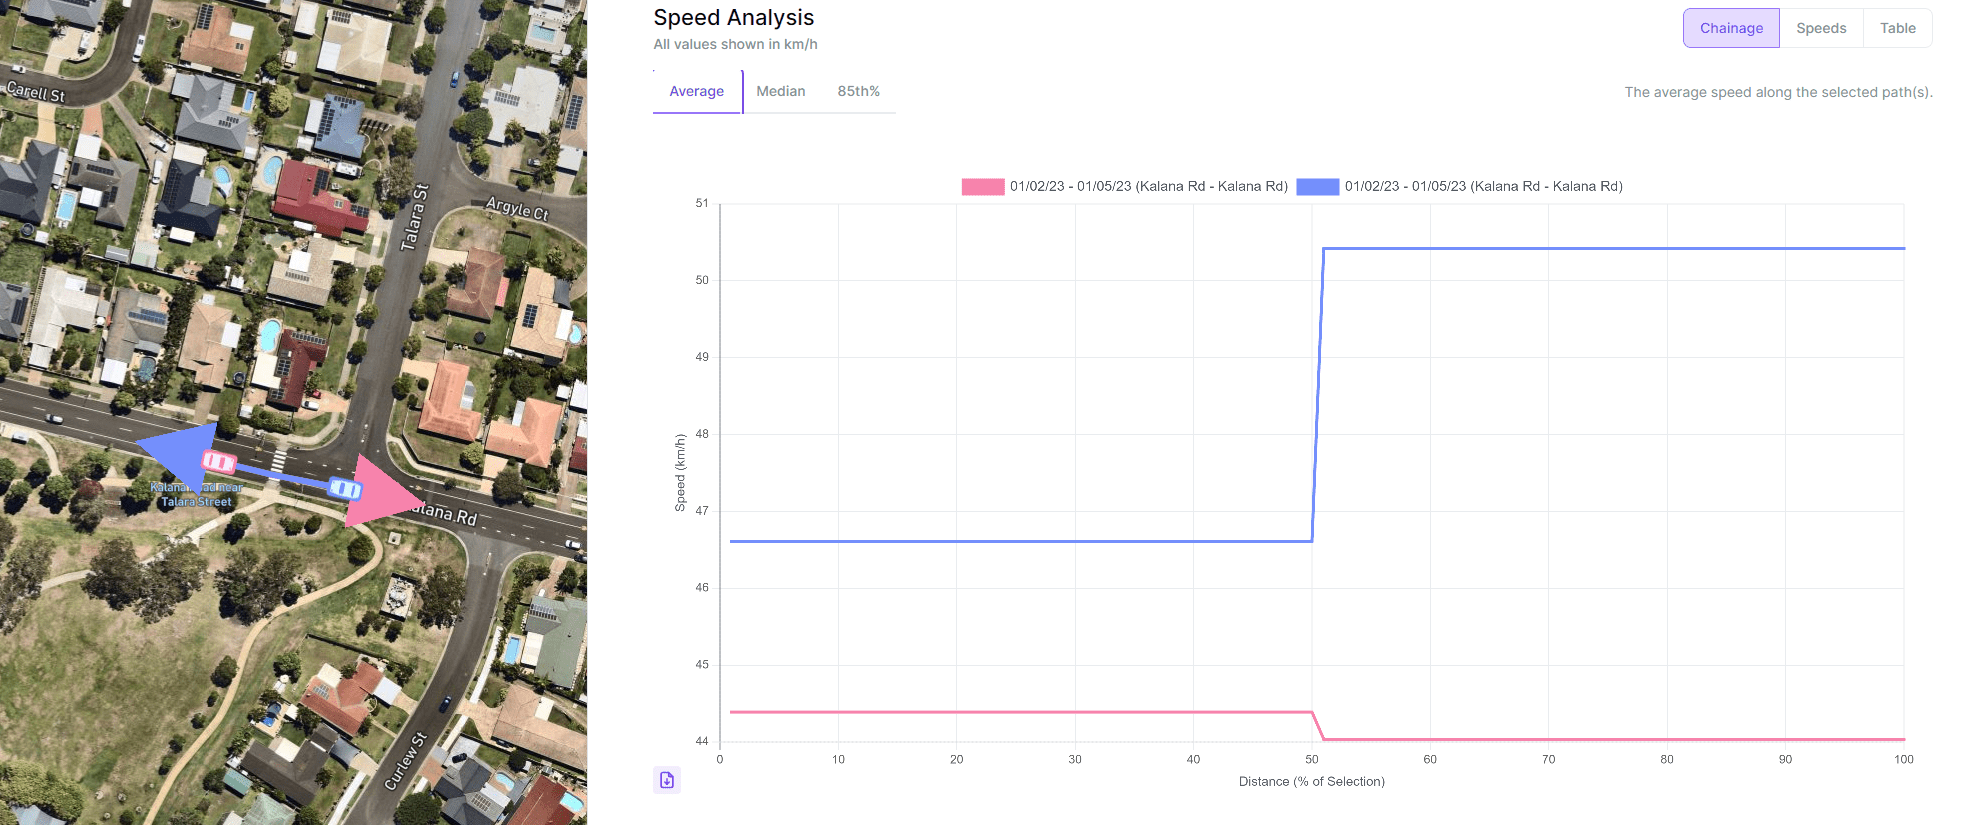
Before the installation, Compass data indicated that average speeds at the crossing were 46km/h in both directions. The 85th Percentile speeds were 59km/h Westbound and 55km/h Eastbound.

Below is an example of a Speed Over Distance graph for Average Speeds before the cushions were retrofitted.
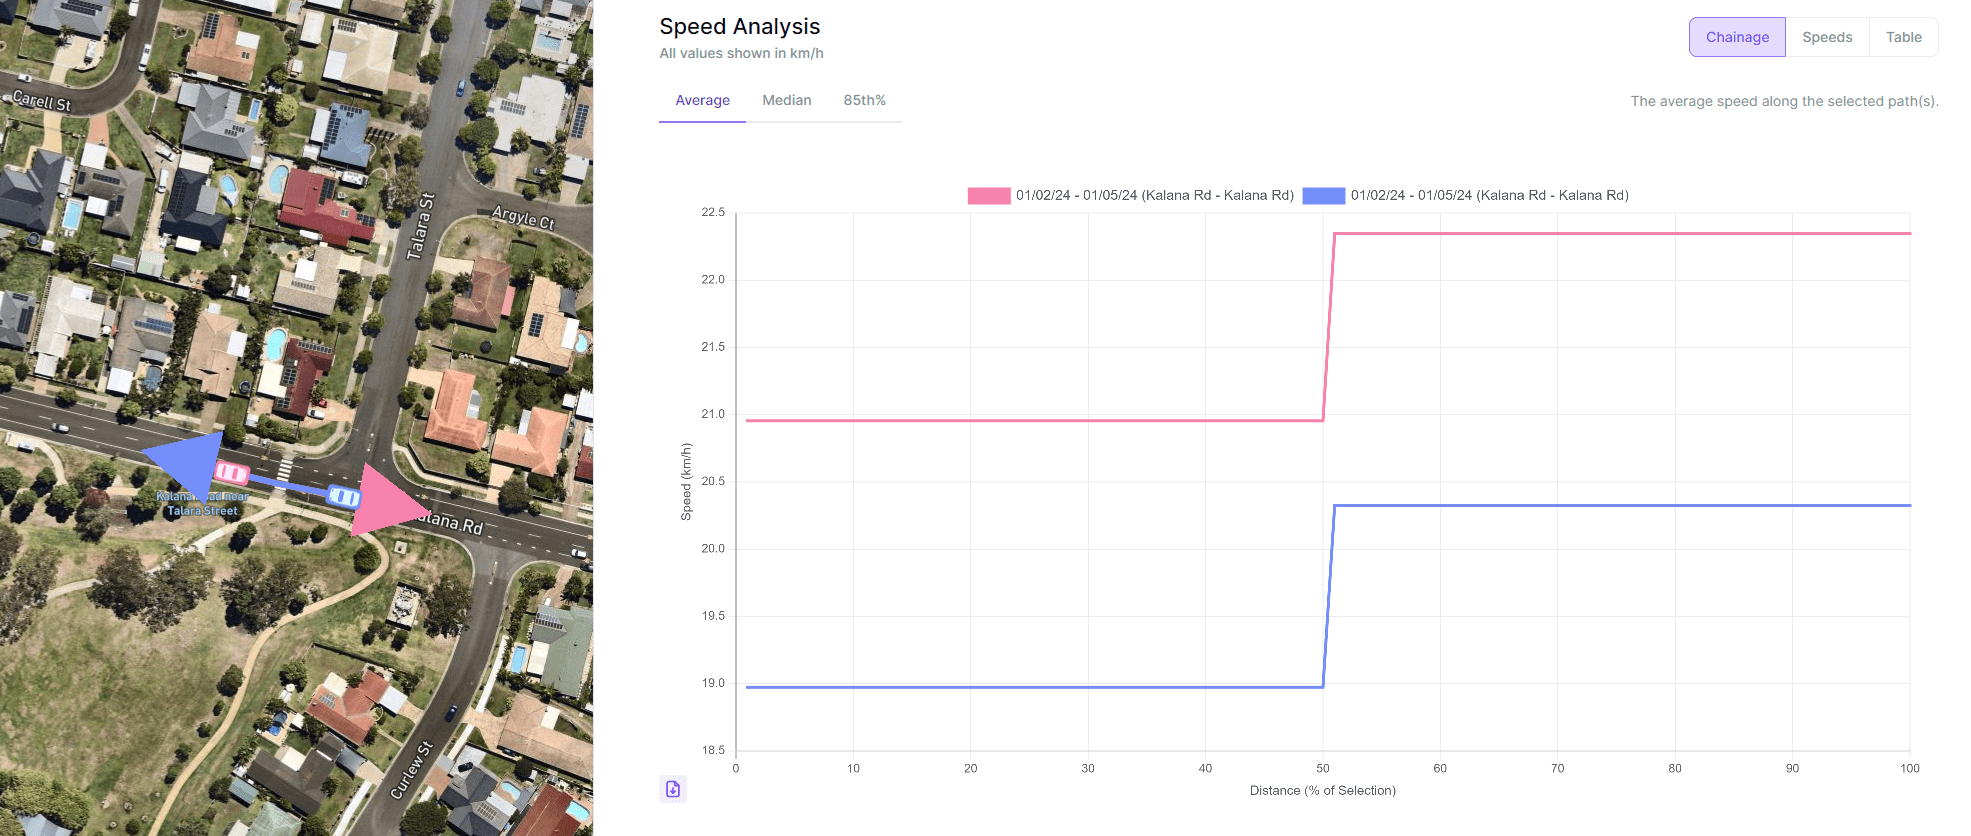
After the installation, the Council identified that speeds reduced by as much as 52% in some directions. Average speed in both directions dropped to 22km/h while 85th Percentile speed dropped to 30km/h Westbound and 31km/h Eastbound. They were able to determine that the cushions had the desired effect of reducing driver speeds at the pedestrian zebra crossing.


Below is an example of a Speed Over Distance graph for Average Speeds after the cushions were retrofitted.
Applications of vehicle-generated data for use cases across state-wide freight modelling, origin-destination studies, VMS signage effectiveness, road safety, and local area traffic management.


