As part of the RILM Project, Transport for London (TfL) wanted to optimise London’s bus network and timetables, supporting The Mayor’s Transport Strategy. This strategy outlines various goals, including having 80% of London trips made by foot, bike or public transport by 2041.
To help achieve this goal and optimise public transport services, TfL specifically, wanted to understand:
Compass ingested, road-matched, and analysed TfL’s bus data so it could be visualised on custom dashboards, and combined with general traffic data for better intersection analysis. This allowed TfL to understand location, speed, journey times and direction of travel for specific buses and route numbers.
Compass’ Data Science team built a dashboard analysing the bus data across the bus network. The dashboard was filterable by date range, day of week, peak period, intersection number and name, intersection leg, and bus route. Within the dashboard, TfL could see how all vehicles (i.e. cars, HGVs, LGVs as well as buses) behaved on bus routes; or just isolate to buses.
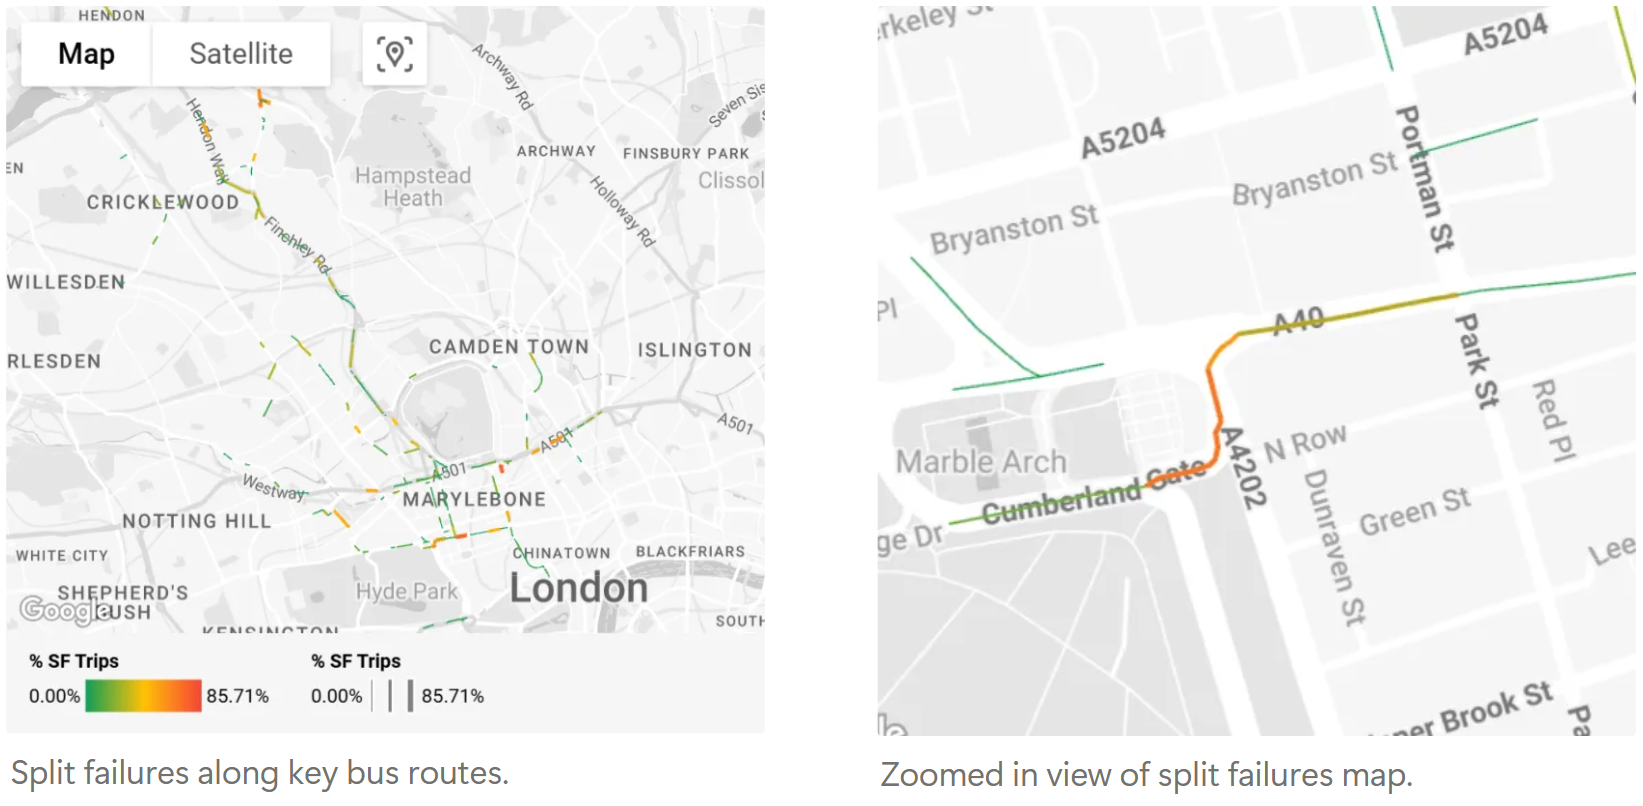
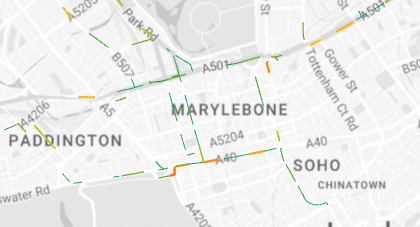
Looking at a sample of data (18-19th Feb), TfL wanted to see where select bus routes (113, 13, 94, 2, 137, 134, and 188) were experiencing split failures. Results identified multiple intersections, with additional insights such as:
TfL are using this dashboard upscale their investigation, understanding where to enhance bus service reliability and optimise signal timing, reducing average journey times across key intersections in London.
This use case is part of the RILM project supported by EIT Urban Mobility, an initiative of the European Institute of Innovation & Technology (EIT), a body of the European Union. To read more about the RILM project, visit https://www.compassiot.com.au/uk/ri-for-london-mobility.
Applications of vehicle-generated data for use cases across state-wide freight modelling, origin-destination studies, VMS signage effectiveness, road safety, and local area traffic management.