Using connected-vehicle data to understand truck rest stops and identify clusters in London.
Book a demo
Transport for London (TfL) wanted to understand where Light Goods Vehicles (LGVs) and Heavy Goods Vehicles (HGVs) stopped within and around London. Specifically, they wanted to know:
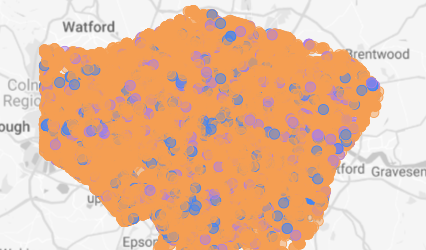
Compass Data Science team built a dashboard to help TfL identify where freight were stopping across the London LGA (and 10km beyond).
Of all recorded trips, the average stop time was 76 minutes, with the minimum being 10 minutes and maximum being 12 hours.
.png)
.png)
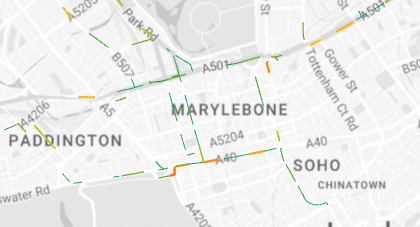
The most common rest stops were made along:
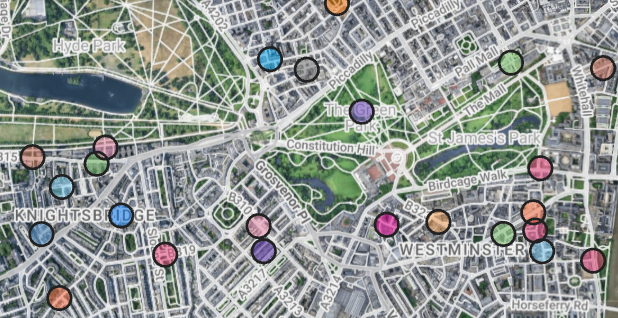
TfL are using this dashboard to understand how freight are behaving across their road network, and to identify where clusters were beginning to develop to notify and share with respective boroughs.
This dashboard is part of the RILM project is supported by EIT Urban Mobility, an initiative of the European Institute of Innovation & Technology (EIT), a body of the European Union. To read more about the RILM project, visit https://www.compassiot.com.au/uk/ri-for-london-mobility.
Applications of vehicle-generated data for use cases across state-wide freight modelling, origin-destination studies, VMS signage effectiveness, road safety, and local area traffic management.