
This lesson has notes and guides only.
The Near Misses tool lets you download g-force data into a CSV file. This is different to the near misses layer which shows you incidents on the map which you can click on for more information.
The Near-Miss tool is best used with the Near-Miss layer turned on.
Once you’ve selected your zone/s, you can click the ‘Download Results’ button and a CSV file will start downloading.
There is no Results panel in the Near-Miss tool.
Based on American research:
As a general rule, we suggest anything that is above 0.47 or below -0.47 is considered potentially unsafe. However, g-forces should be reviewed in relation to the road context.
Try using the Near Misses tool to understand travel times, trip volumes, hourly breakdowns, and Edge Usage Ranking (EUR) across Sydney. We'll see how people travel between Manly, Macquarie University, and the Sydney Harbour Bridge.
0:00
This tool allows you to download near-miss data from the map.
In order to use the Near-Miss tool, you need to have the near-miss layer turned on. The difference between the Near-miss tool and the near-miss layer is the near-miss layer will show you on the map where you have near-misses or friction loss events, whereas the Near-Miss tool will allow you to select a zone to then download that information into a CSV file.
0:27
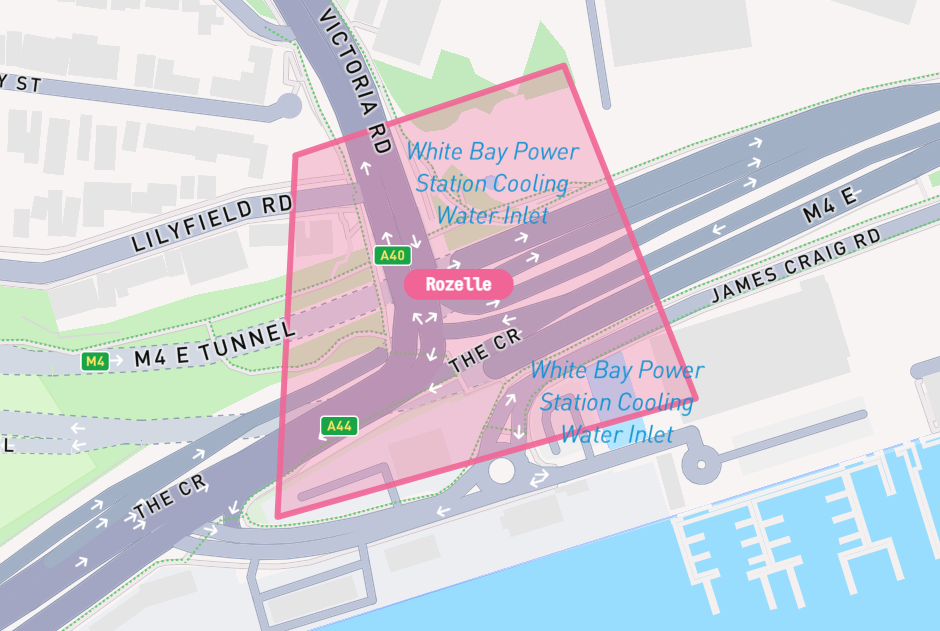
There are a couple of ways that you can select a zone. The first one is using a WKT file to create a polygon. The second is that you can create an organic polygon to select a certain area. And then lastly, we have pre-selected boundaries. This allows you to select pre-selected areas - such as postcodes, suburbs, or SA2s, SA3s, SA4s - to download all near-miss information within that boundary for the dates that you have selected.
We'd love to hear what you think. Leave your details below if you'd like to be contacted.